Project info

Agency
Self initiated, Signal Noise, CLEVER°FRANKE
Year
2018
Technology
Electron, NodeJS, WebGL, ThreeJS, Elastic Search, Gephi
Role
Research, concepting, analysis, development
Making sense of what is happing in our online behaviour by creating a visualisation that runs on live data

Problem

Solution

Problem

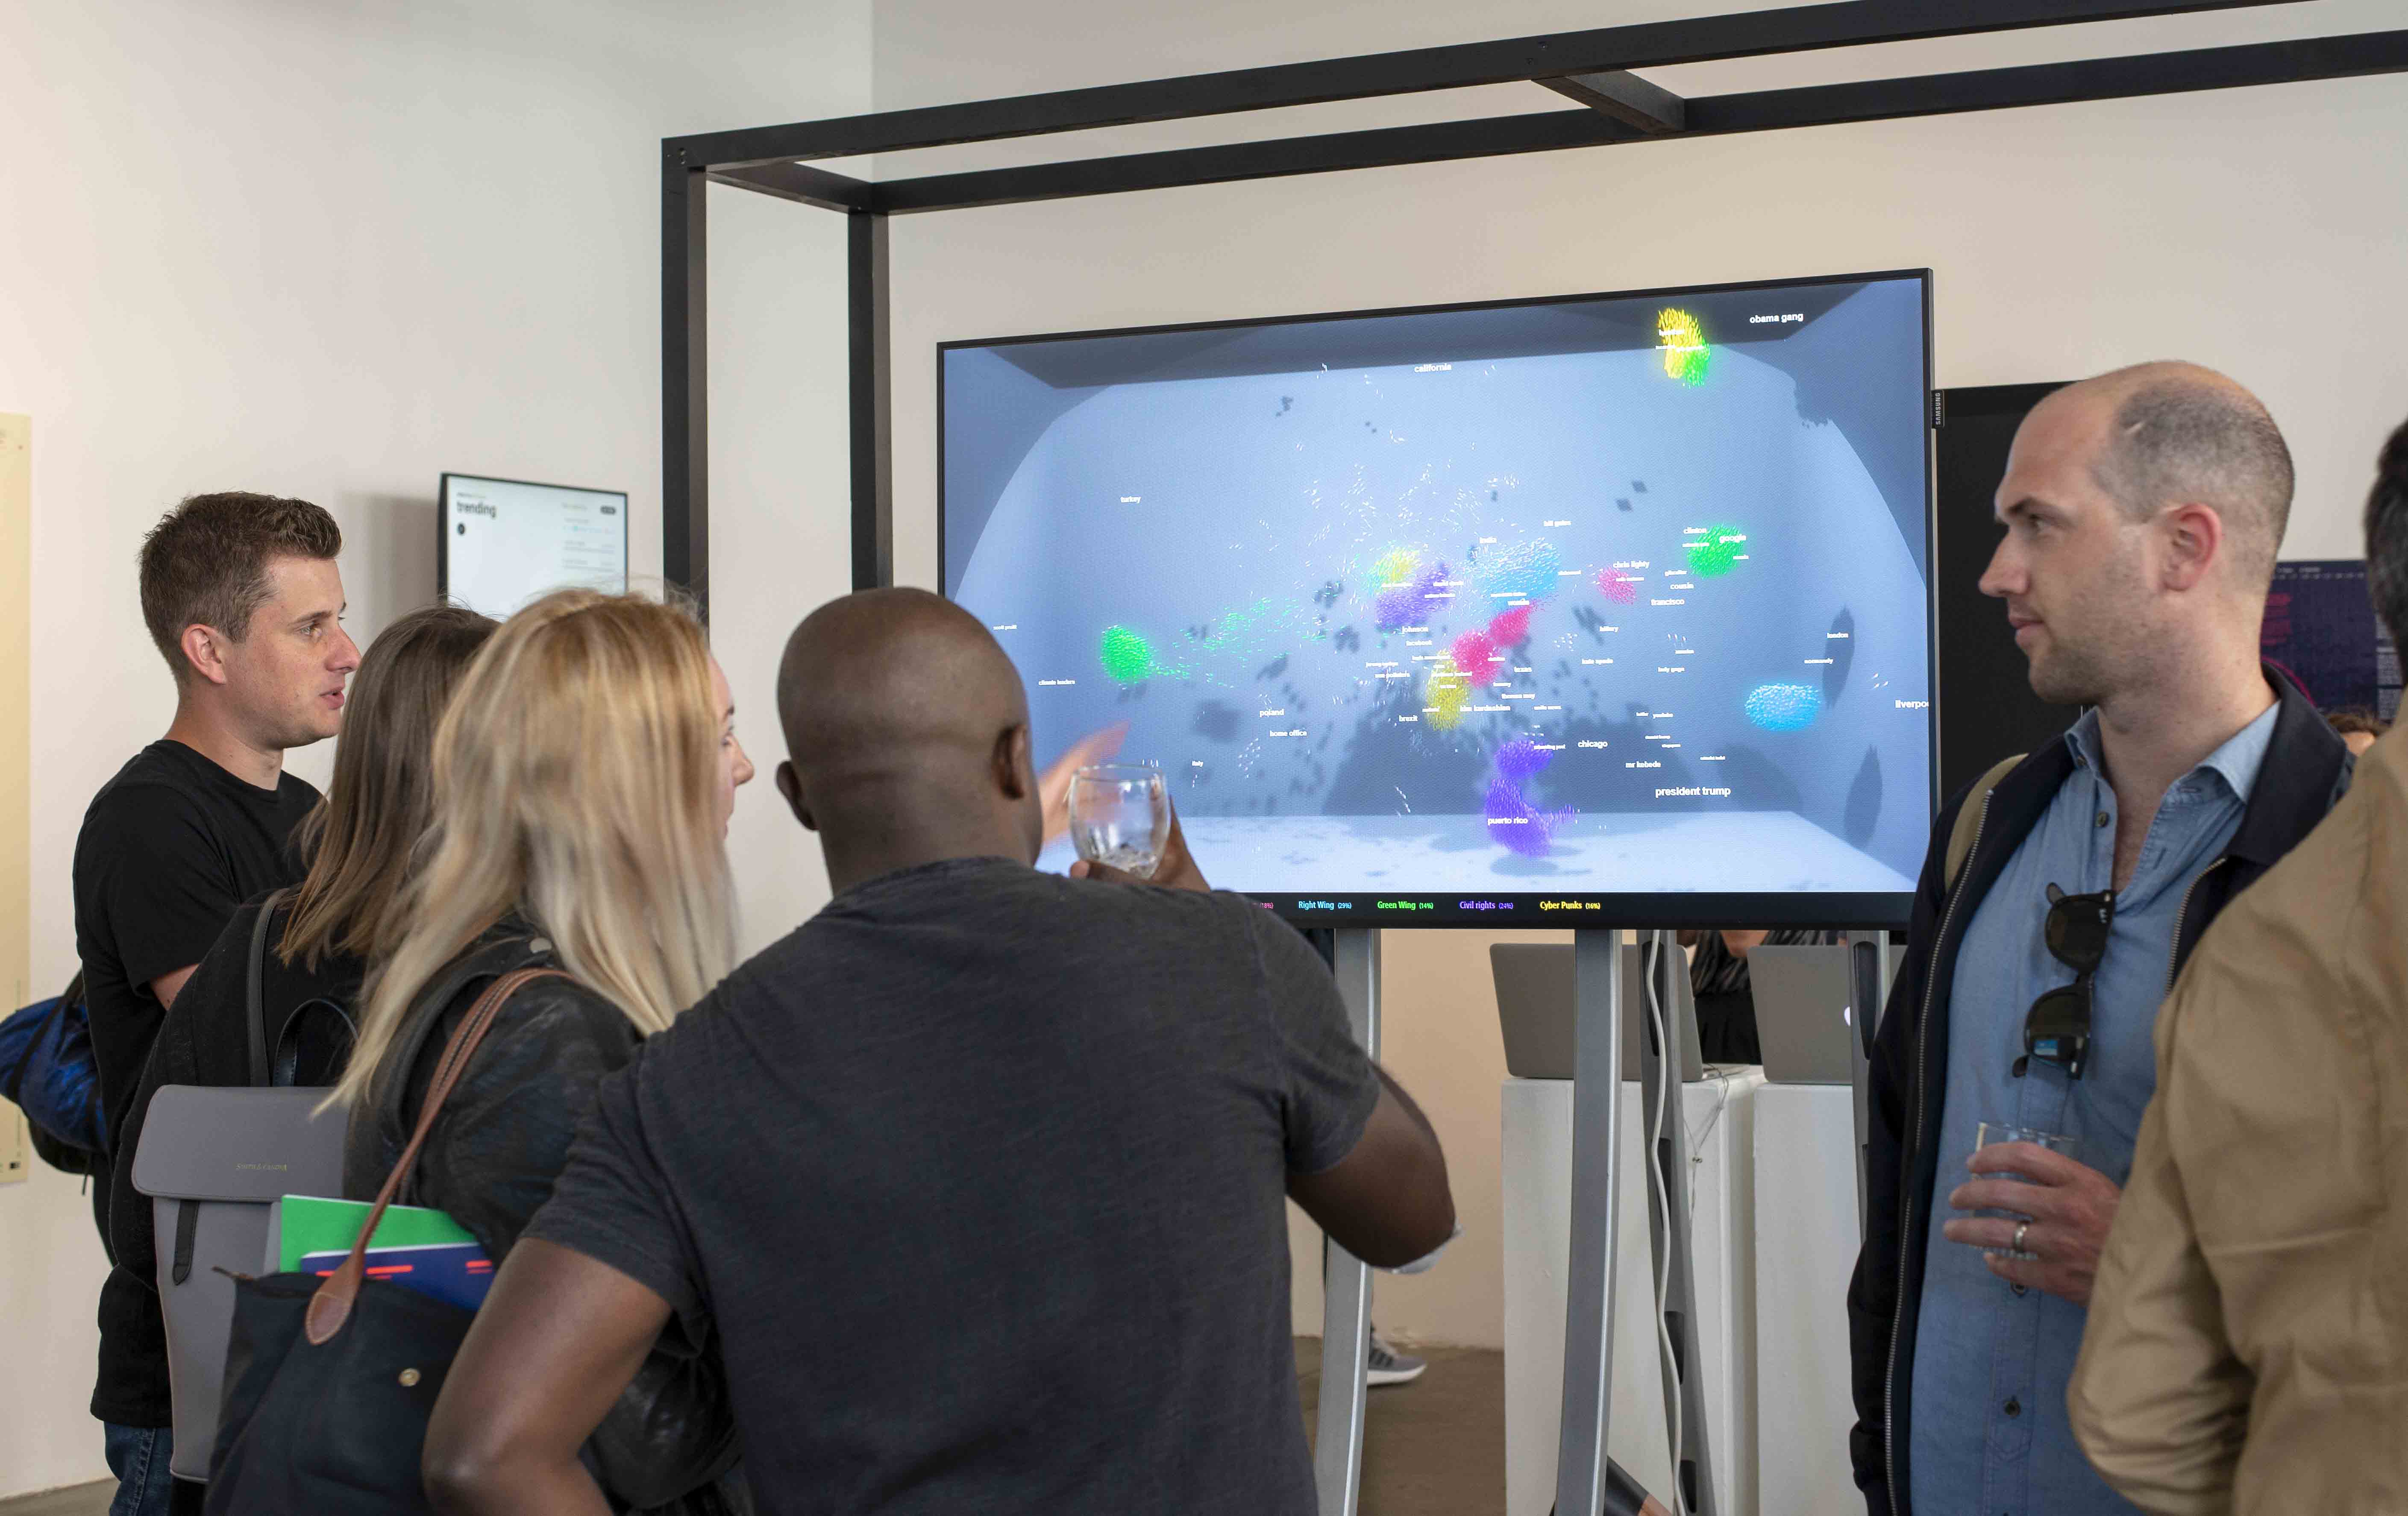
The internet got rid of all physical barriers involved in communicating with others. This led to the utopian view that the internet could lead us to a better understanding of each other due to having access to a much wider range of views. Lately, that utopian view has been shattered. Our media consumption is leading to more and more extreme and polarized views. Instead of enriching the debate with a plurality of views, it seems like the opposite has happened. Different groups of people no longer seem to share even basic foundational beliefs.

We’ve all become part of this tribal ecosystem. We confine ourselves to the beliefs and ideas of our tribes. Even though access to opposing views has become easy and even unpreventable, we choose to ignore those views and opinions. The truth and our ability to trust experts has become inferior to our tribal identities. We’ve created our own echo chambers whereby we only listen to reverberations that reinforce our existing tribal beliefs.

Solution

The Echosystem is a data visualisation that captures this tribal ecosystem by scraping and analyzing thousands of news and twitter messages. By categorizing the users sending these messages tribes can be formed. All this data drives a large simulation that can best be explained as a “digital fish tank”. The ecosystem will change over time depending on the news and online discussions, which can be observed by looking at this visualisation.

Exhibition

Photograph of viewing night showing people looking at a screen showing the Echo System.

Data curation

An image showing all online groups indentified for this project
The data for this project is scraped from news outlet and twitter sources. These news outlets are seen as (more or less) neutral and a baseline for the underlying graph making the media landscape. Next, I’ve made a curated list containing 600 prominent twitter opinion-makers which have been categorised in tribes and subtribes.

Data analysis

The following tech stack has been used to fetch, analyse and visualise the data

Preview

Lesson learned
It's possible to do unconvential storytelling by using algorithms to visualise patterns based upon live data

Projects

Click on a project to read more

About

scroll down to go to about page