Project info
Agency
Signal Noise
Year
2017
Technology
NodeJS, WebGL, ThreeJS, D3, Electron
Role
Concepting, analysis, development
Experimenting with predictions by combining data sets together in an unordinary visual, made for an exhibition of Signal Noise in London
Problem
Solution
Problem
Gentrification is a hot topic in London currently. Most people see Shoreditch, the place where the exhibition took place, as the most gentrified area in London, and is seen by some as being over-gentrified. We asked ourselves the question: “We all know that Shoreditch is full of hipsters, but where will they migrate to next?”.Solution
To predict gentrification in London we need to predict the sweet spot for areas that are currently deprived, but are still diverse so ‘pioneers’ feel welcome. So to predict gentrification deprivation data should be combined with diversity data. Gentrification could be seen like pressure zones in weather. People are attracted to low-pressure zones until that area has too much pressure itself and people move on to next areas. Fluid simulations are therefore used to predict future patterns. Since wind patterns have been used to predict the future of gentrification, it makes sense to visualise gentrification as wind patterns too.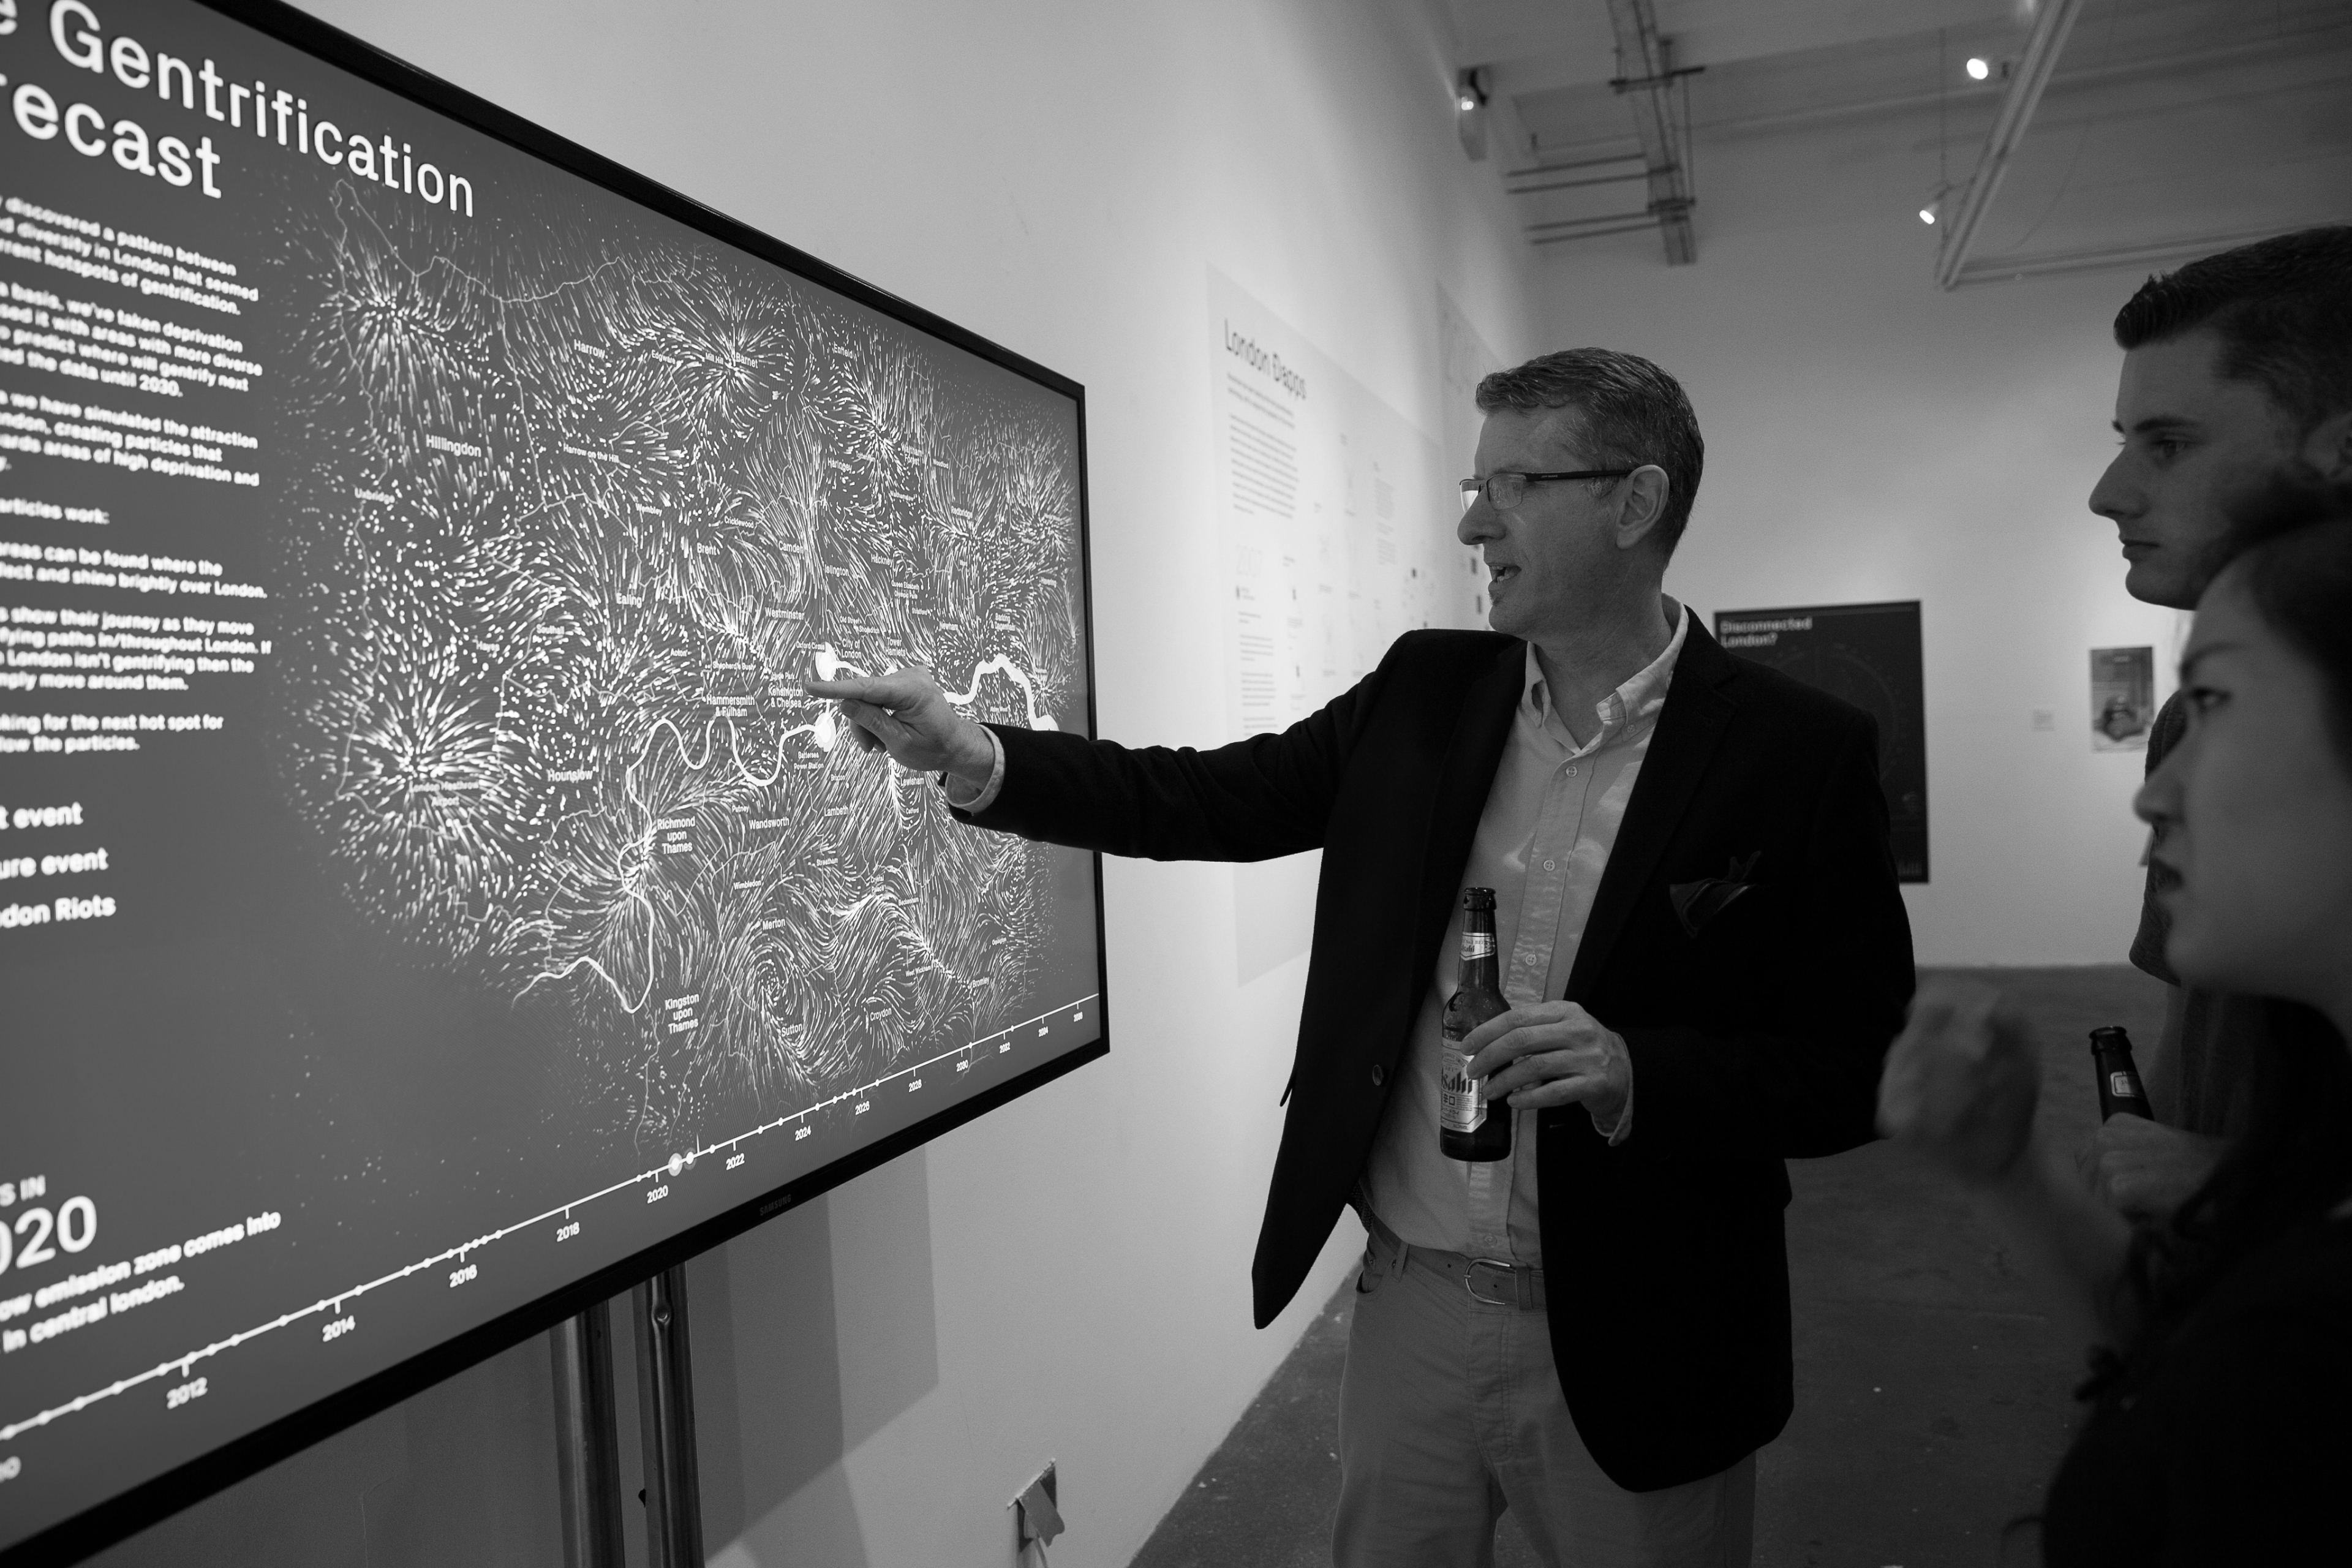
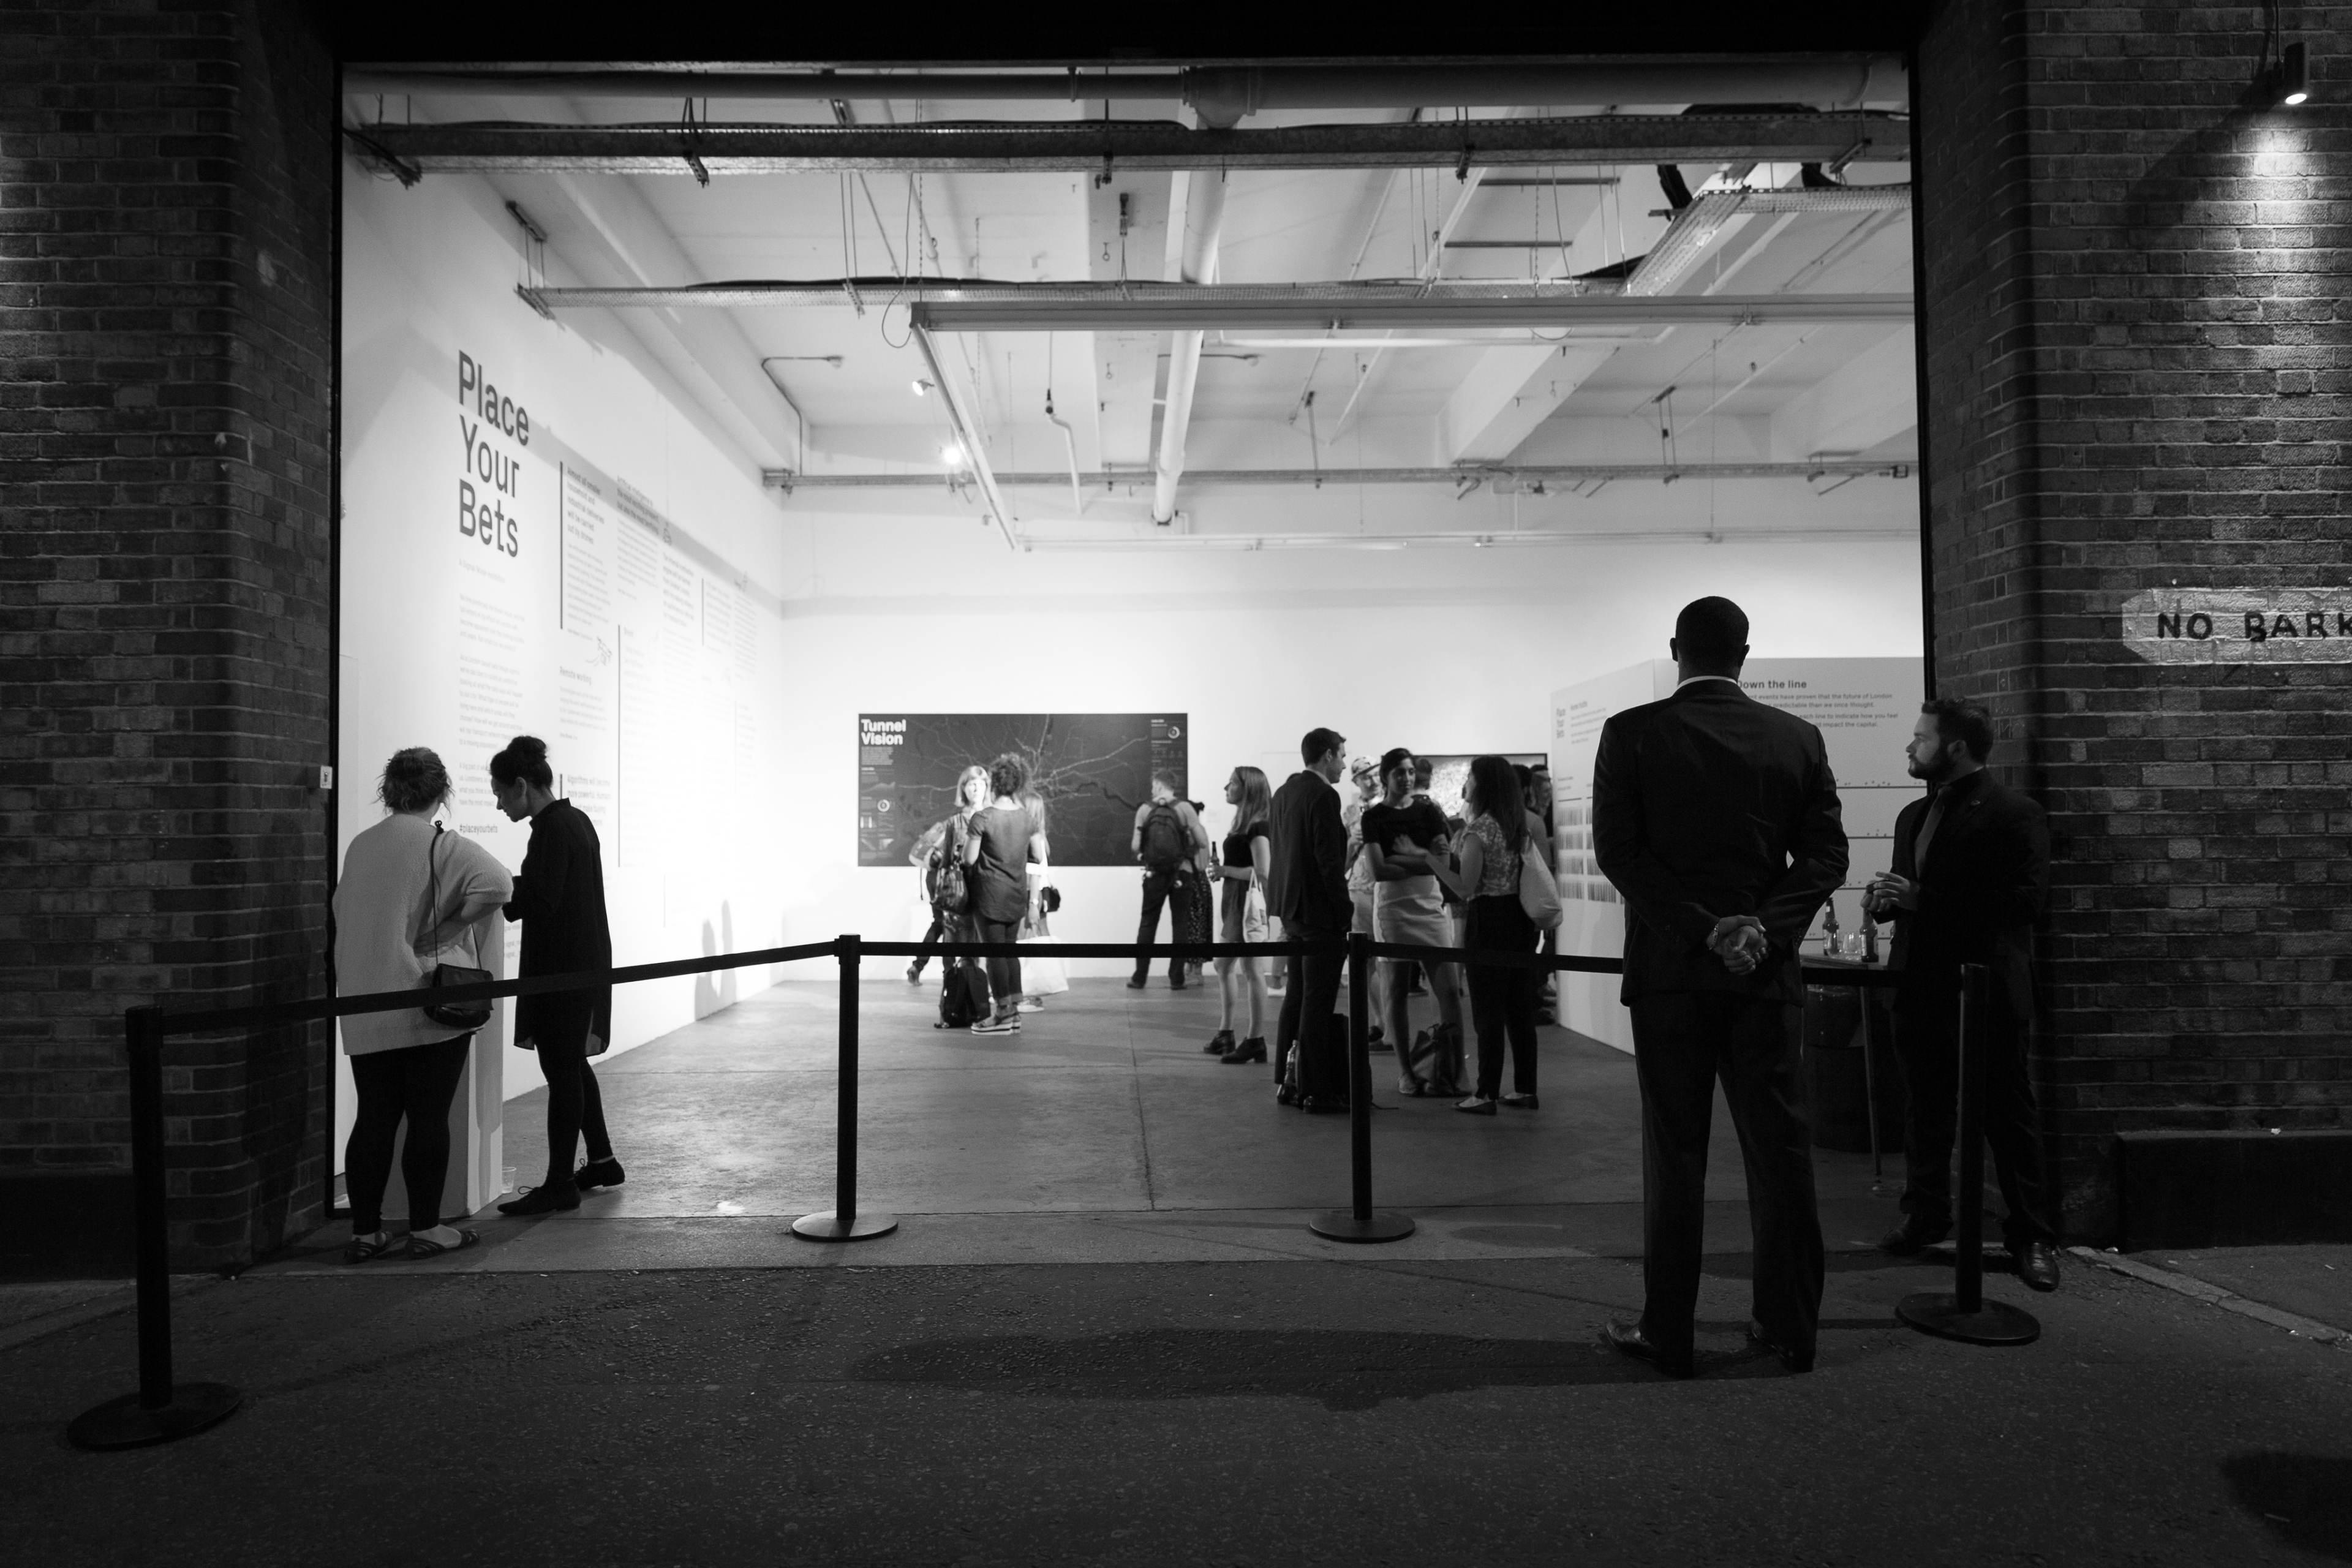
Exhibition
This project was part of the 'Place Your Bets' - a Signal Noise exhibition part of the London Design Festival. This exhibition was aimed at looking into the future of London, by using data. The location of this exhibition was in Shoreditch, an area heavily impacted by gentrification.Data analysis
These visualisations are created using the following processes to convert data in 3d graphicsPreview
Lesson learned
By looking with a fresh eye to data analysis you can find new refreshing insights and methods of visualising data. Projects
Click on a project to read more