Project info
Agency
Signal Noise
Year
2018
Technology
Electron, NodeJS, WebGL, ThreeJS, D3
Role
Design, development
Making telemetry data come alive so the wealth of data becomes clear to stakeholders.
Problem
Solution
Problem
The client for this visualisation was looking for help in visualizing the large amount of telemetry data they possessed. This telemetry data is being collected by an app that tracks it users by GPS and phone sensors. Even though this team was busy collecting this large set of data, they were struggling to prove to their shareholders how much wealth is in this data set.Solution
Creating a tool that enables the user to create data stories with this telemetry data. There are multiple metrics available per ride in this data set like; speed, braking force, driver score car brands and user groups. To create a story a user can select a city, metric and setup the parameters for visualising and, if needed, apply filters to the data set. A user can then run the animation that runs through the whole day. Next to this the user can control the camera and clock themselves to see patterns at different times.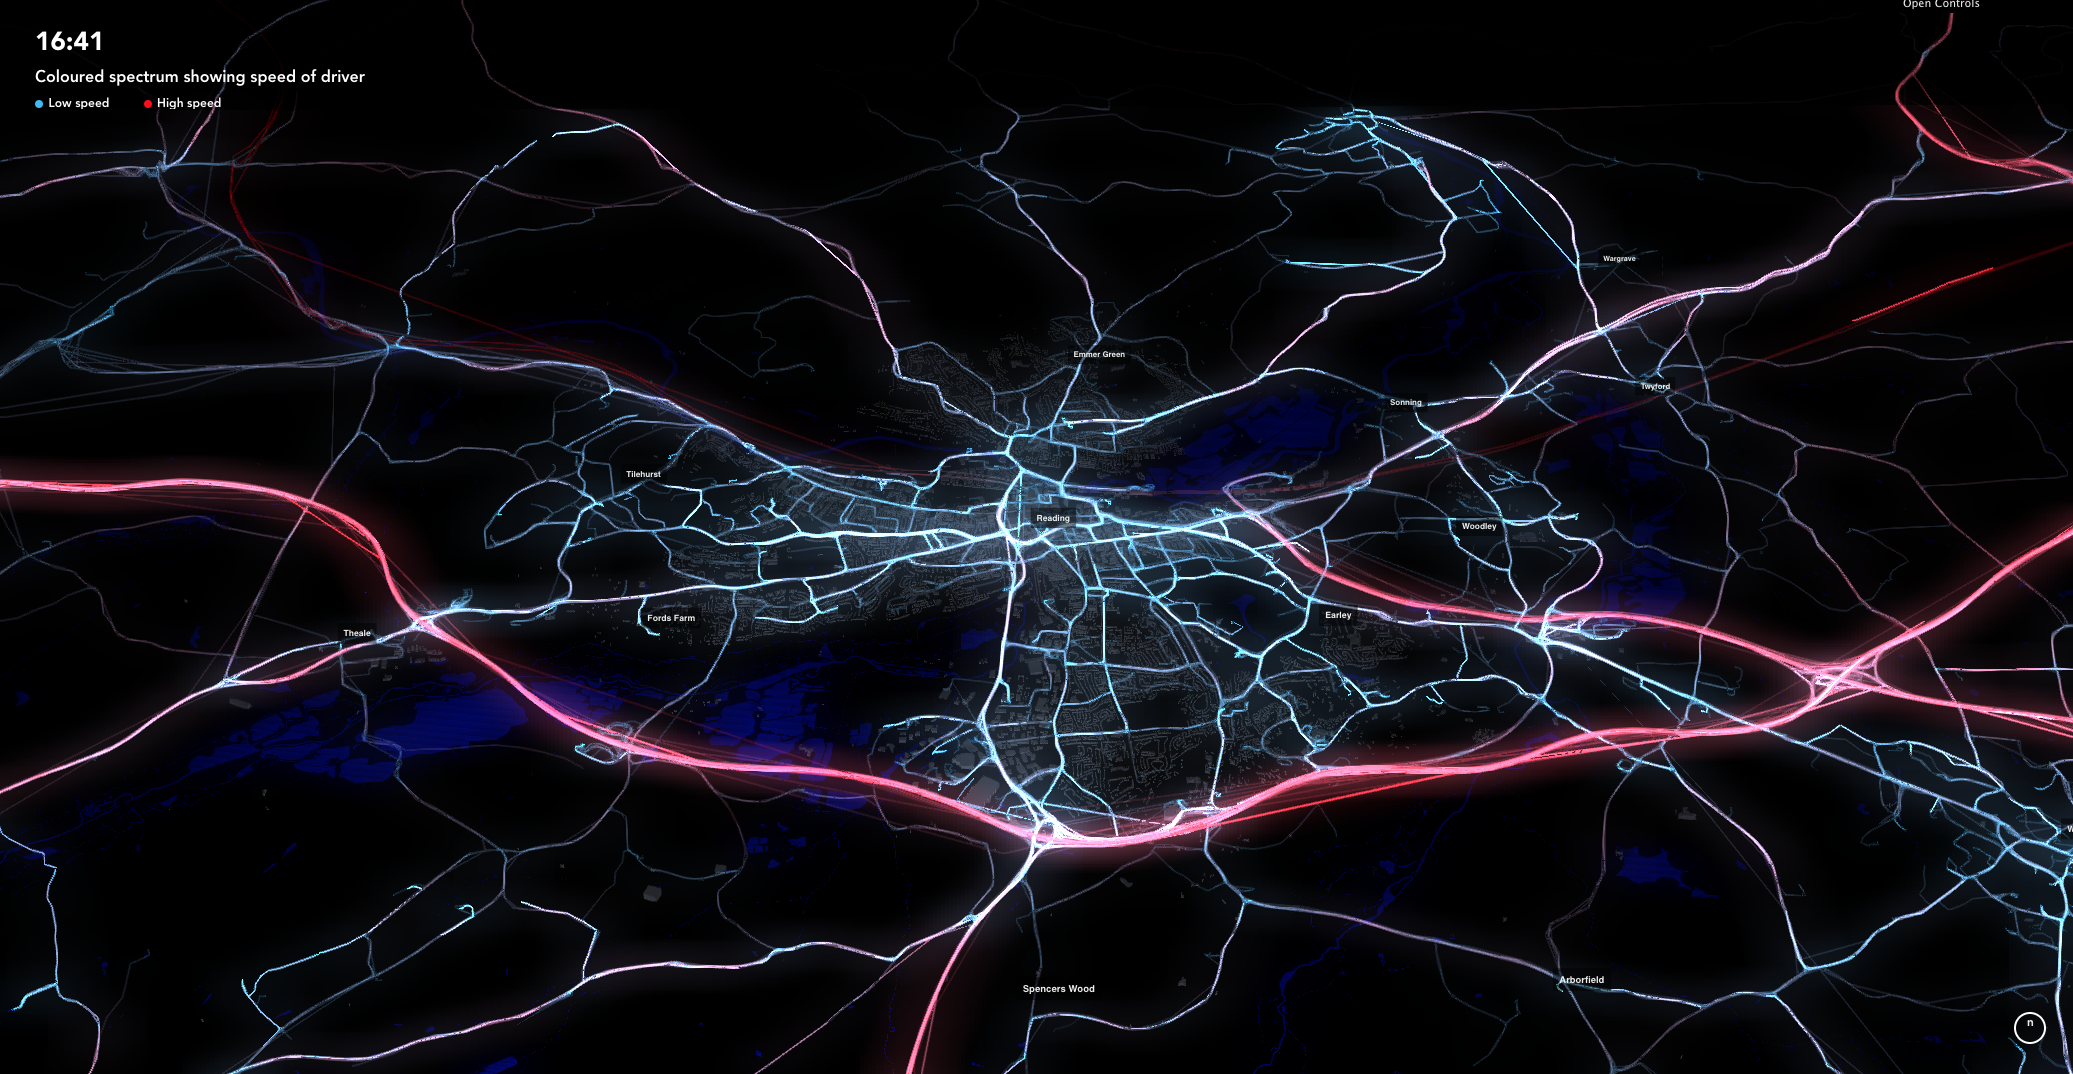
Lesson learned
By creating data stories viewers can explore the wealth of a data set in a more comprehensible way. Projects
Click on a project to read more